About
For our analysis on looking at misinformation on Reddit, we thought it would be interesting to analyze the differences and/or similarities of two kinds of misinformation, while having the baseline diffusion of scientific information. To do this, we had set up three main categories of (mis)information we wanted to look at: myth (urban legend) misinformation, political misinformation, and scientific information. Below, you can find the list of the subreddits we looked at for each category. We gathered comments from posts within these subreddits during the months between March 2020 - June 2020.
| Category | Subreddits |
|---|---|
|
|
r/bigfoot, r/Humanoidencounters, r/BigfootEncounters, r/conspiracy, r/wanttobelieve, r/SasquatchAttacks, r/squatchersonly, r/UrbanMyths, r/ufo, r/UFOs, r/aliens |
|
|
r/The_Donald, r/DonaldTrump, r/flatearthsociety, r/tucker_carlson, r/HillaryForPrison, r/climateskeptics, r/benshapiro, r/China_Flu, r/LockdownSkepticism, r/WalkAway, r/antifapassdenied |
|
|
r/science, r/EverythingScience, r/climate, r/COVID19, r/PandemicPreps, r/CoronavirusRecession, r/askscience, r/Health, r/Ebola, r/medicine, r/publichealth |
To gather the data, we used pushshift.io, a Reddit API as it allows us to look at archived data, specifically for subreddits that have either been banned or removed. Using this API, we gathered for each Reddit post:
- username
- date of post
- subreddit that this post belongs in
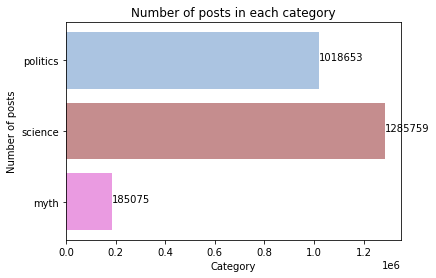 There are about 1 million rows collected for the politics category, about 1.2 million comments collected from the science category, and only about 185 thousand rows from the myth category. The data is heavily skewed towards the politics and science categories because the subreddits from these categories are much more popular compared to the ones from myth.
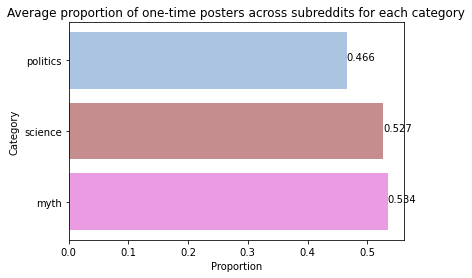 This chart shows the proportion of users who only posted once in a subreddit. This shows the proportion of users who are only “visitors” of a subreddit as opposed to a regular of a subreddit. This chart was produced by taking the proportion of one-time posters in each of the subreddits individually and then took the average of all the subreddits in that category.
This chart shows us that a little more than half the posters in the science and myth categories are one-time posters only. However, in the politics category, only 46% of the posters are visitors. This means that the users in the politics category are more likely to frequent the same subreddits compared to the users in the science and myth categories.
This chart shows the proportion of users who only posted once in a subreddit. This shows the proportion of users who are only “visitors” of a subreddit as opposed to a regular of a subreddit. This chart was produced by taking the proportion of one-time posters in each of the subreddits individually and then took the average of all the subreddits in that category.
This chart shows us that a little more than half the posters in the science and myth categories are one-time posters only. However, in the politics category, only 46% of the posters are visitors. This means that the users in the politics category are more likely to frequent the same subreddits compared to the users in the science and myth categories.
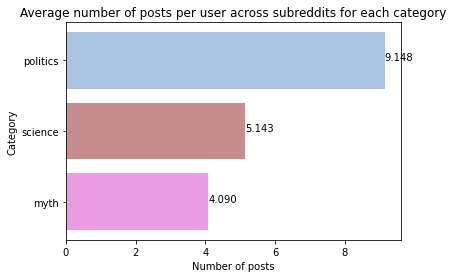 In this chart, we can see that in the politics category, a user on average writes about 9 posts, while on average a user makes about 4 and 5 posts in the science and myth categories. The high average number of posts in the politics category compared to the other two categories leads us to believe that users in this category are more likely to be a regular user of a subreddit. This may indicate echo chambers.
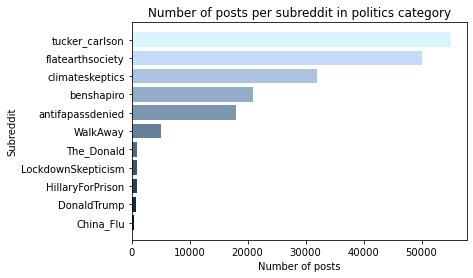
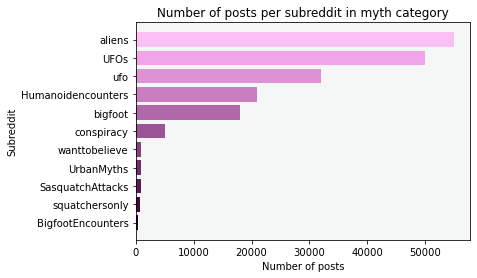
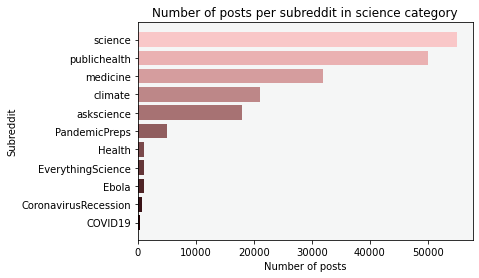
The graphs above are the number of comments collected per subreddit in the Politics, Myth, and Science categories respectively. This showcases the more "popular" subreddits in each category, like r/tucker_carlson in the political subreddits, r/aliens in the myth subreddits, and r/science in the science subreddits.