Classification of Myer-Briggs Personality Type
Our project revolves around predicting Myers-Briggs Personality type. The dataset that was used was one pulled from Reddit. This dataset consists of three different columns, consisting of the personality type of the user, the body of the text within their post, and the subreddit that this post was found in. The personality type was any of the 16 personalities, e.g. INTJ, INTP, INFP, etc. There are four main types of personalities, and within each umbrella, there are four specific personalities. In other words, Analysts, Diplomats, Sentinels, and Explorers are the four kinds of personalities that there are. Within each kind of personality, it is further broken down into four specific personalities, where for example, analysts are further reduced down to INTJ, INTP, ENTJ, or ENTP. These four umbrella terms each give way to four other personality types, which is why there are sixteen in total.[1]
There are approximately 1,555,110 rows within the dataset. There were only 23 rows where the text column was considered missing in the dataset, but because the dataset is so large, we are able to drop it without imputing. After dropping those 23 rows, we sampled 500,000 rows for all of our models. We used 400,000 for the training set, 50,000 for the validation set, and 50,000 for the testing set.
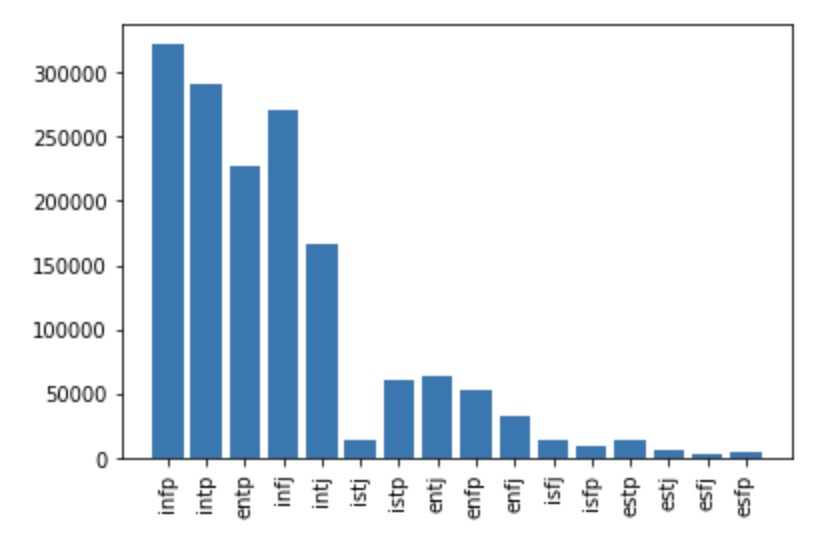
To further understand the data that we are working with, we performed some preliminary exploratory data analysis. We first analyzed the distribution of the 16 personality types in our dataset.
Distribution of 16 Personality Types
We noticed that in our dataset, we have more introverted type samples than we do of extraverted types. To combat this imbalance, we analyzed the data distribution again, but this time using the broader personality types: Analysts, Diplomats, Sentinels, and Explorers.
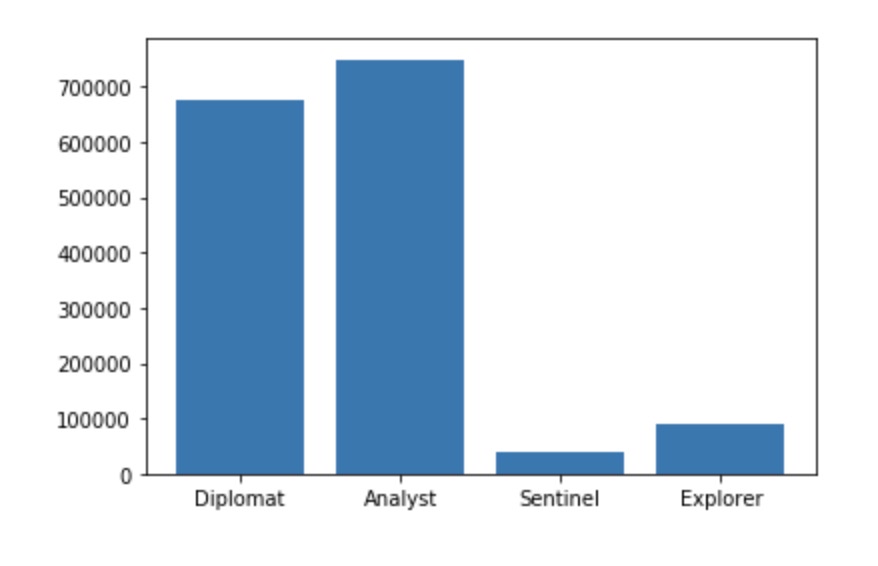
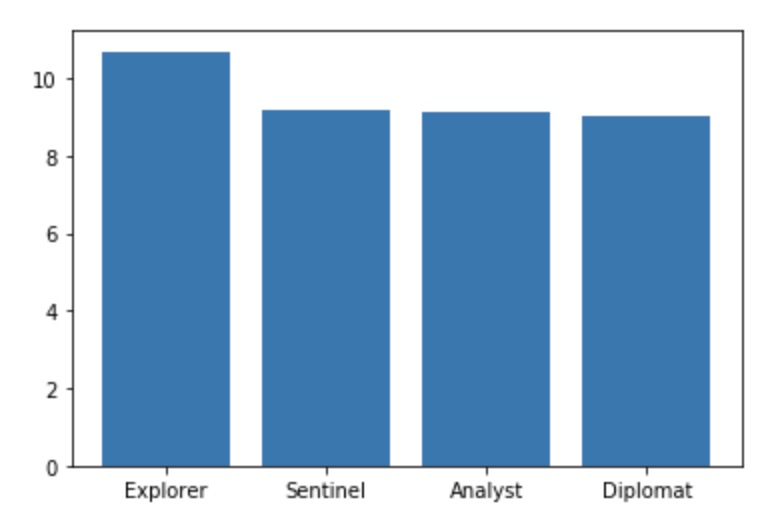
Distribution of type group in dataset
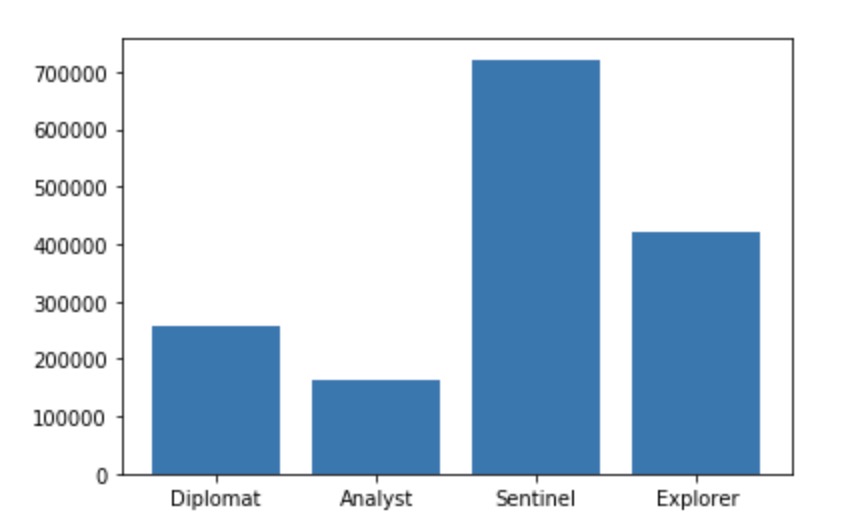
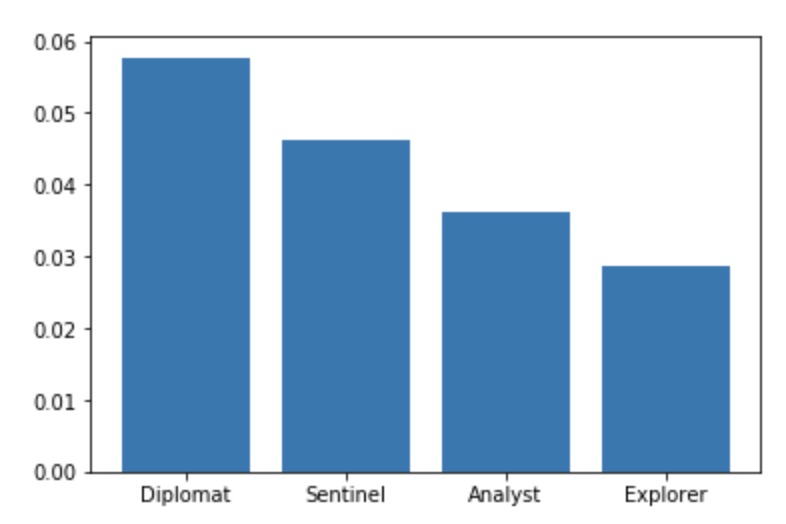
Distribution of type group in population
From looking at these two plots, we noticed that Analysts and Diplomats were heavily more represented in our dataset than Sentinels or Explorers. However, compared to the population distribution of personality types found on Career Planning[2], the data bias towards Diplomats and Analysts that we are seeing here is not typical. In the actual population distribution, Sentinels and Explorers are actually a lot more common compared to Diplomats and Analysts, which is the opposite of what we found in our dataset. Due to this observation, we sampled 500k rows with a more even distribution of types when building our model to help prevent prediction bias.
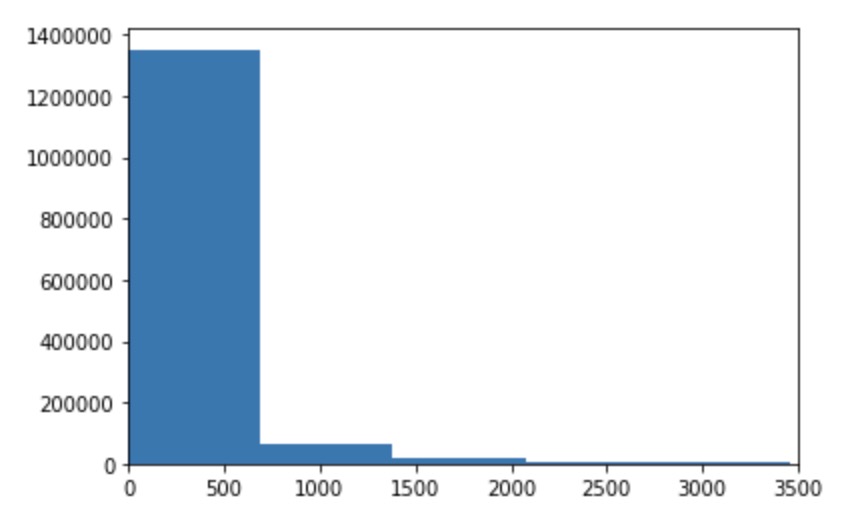
Histogram of character count
After understanding the distribution of our dataset better, we further explored the data performing univariate and bivariate aggregations. We also wanted to look at the distribution of character count in posts and observed that 99.5% of our data has a character count of less than 2500. To further break this down, we also plotted EDA on this.
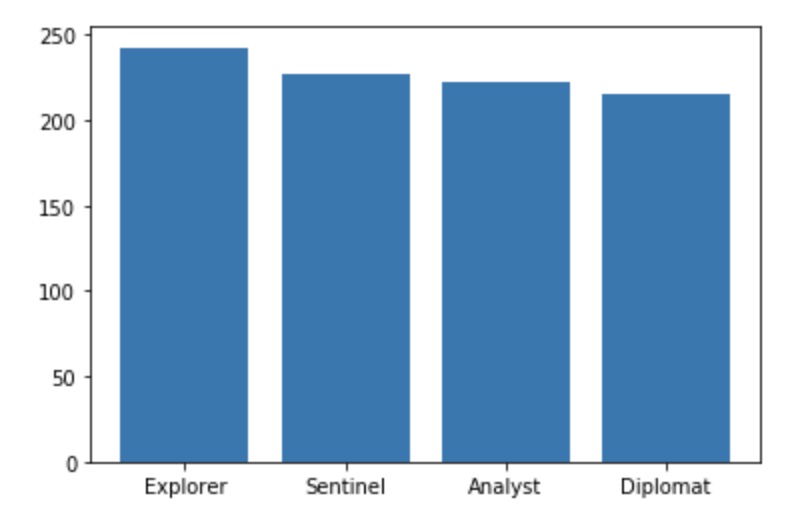
Average character count of post by type group
We wanted to take this observation further by seeing if personality type has a correlation with the length of a Reddit post. It appears that Explorers on average tend to use slightly more characters than the other type groups in their posts. Diplomats tend to use the least amount of characters. However, all 4 groups seem to fall around the 200-250 characters range.
Average punctuation usage in post by type group
We also wanted to know if certain types utilize more punctuation on average than others. We looked at their average punctuation usage and compared it across all 4 groups. Similar to the previous analysis, we noticed that Explorers tend to use more punctuation and Diplomats use the least.
Average emoji usage in post by type group
We also plotted to see if emoji usage is correlated with certain types. We were surprised to find that unlike the previous two observations, emoji usage showed the complete opposite. Diplomats use emojis at almost double the average frequency than Explorers do. Our findings indicate that there may be a correlation between emoji usage and punctuation usage between the groups.
With our analysis developed through our observations in exploring the data, we decided to focus on these features when building our initial baseline model.
For this project, we wanted to develop a model with the predictive task of classification. More specifically we want to develop a model to predict personality type. Initially, we wanted to predict each of the 16 types for each test user, however, we decided to focus on predicting type groups to reduce complexity. To evaluate our model, we will be using an accuracy score as this will let us know what proportion of the data is our model is predicting the correct answers.
Baseline Model
In order to develop a good model, we need to start off with a basic baseline model.
For this step, we decided to use Logistic Regression with no specified regularization coefficient to classify the 4 different categories since it is easy to implement and fairly fast. The features we used for this model are the features we analyzed in our exploratory data analysis. For each post, we extract these features: the character count, emoji count, and punctuation count. As we mentioned from the previous section, we noticed that there may be some correlation between these features with the different personality type groups which prompted us to build a model on these features.
To extract these features for our model, we needed to do some preprocessing. To obtain the character count features, we applied a function to the text column and calculated the length of the post. To obtain the emoji count feature, we looked up the most common 25 emojis used in text posts and applied a function to count the number of times emojis appeared in a post. To obtain the punctuation count feature, we applied a function to count the number of occurrences of any punctuation in the English dictionary for each post.
To assess the validity of our model, we split our data into train, validation, and test sets with a sample of 500k rows. We tried to make our data sample as balanced as possible with the four personality groups by having similar sample counts. We then trained our Logistic Regression model with these 3 features and with a personality type group as our target output using the training set. We then validated our outputs by running our model on our validation set. We got an accuracy score of only 25.3% which is only slightly better than random with random being 25%.
As we expected, due to this being the baseline model, it did not perform very well. In terms of the different classifiers we will be discussing in the next section, we decided to utilize the same preprocessing methods for all of them to ensure fairness when comparing our evaluation metrics. We only preprocessed the text within the body column by normalizing, with the use of making the text all lowercase, getting rid of punctuation and stop words, and stemming. After this, we were able to vectorize this by using a tf-idf vectorizer. In the next few sections, we will go into depth on the kinds of classifiers we experimented with and the steps we took to decide on the final model.
KNN (K-Nearest Neighbors)
To try and improve our model from the first iteration, we tried a KNN model. We chose this because it is very simple and easy to use and it only has one hyperparameter. The problem we encountered is that it is really slow especially when you have large input values. To try to solve this problem, we use Principal Component Analysis (PCA) to identify the combinations of columns that account most variance in the data. [a]This certainly improved the runtime speed, but the accuracy for my test result is around 50%. We believed the KNN did not do so well because the data itself is not balanced.
SVM
The next model we developed was an SVM model. Initially, when we had tried our model with sixteen possible predictions for personality type, we were getting a poor accuracy metric at around 0.28. We thought this might be due to having too many classifications, so we decided to narrow this down by just looking at the four major personality types (analyst, diplomat, sentinel, and explorer). Changing the predicted classifications from sixteen to four greatly improved the classifiers we were looking at. For example, changing just the classification improved our SVM model’s accuracy from a 0.28 to 0.57, which is still a huge improvement from both the 0.28 in the initial SVM model as well as the baseline model we have developed. This is fairly decent, since a completely random SVM model would have an accuracy of 0.25 since there are only four classifications to choose from. SVM is based on finding the ideal hyperplane that would best separate the features to develop the best and accurate predictions. I thought this classifier would work well because people within the same personality type are supposed to be similar in terms of personality, so I had believed that there would be a pretty clear margin of separation to work with. But one disadvantage to this is that there are a lot less occurrences of the Sentinel and Explorer type personalities, which might make this particular model overfit to the data points that we do have a lot of, which would be the Diplomats and Analysts. Further, one other drawback to this classifier is that it does not work well with larger datasets. But intuitively, it would make sense that the more posts we have for a user, the better prediction we might make for their personality type. So, even with a dataset with large amounts of information per user, SVM does not utilize the advantage that comes with a larger dataset very well.
Neural Networks
There is a saying that the more data you feed into the neural network, the better result it gets with time. In this case, we were fortunate to stumble upon such a large dataset. We wanted to try if it was possible to get a much better result compared to traditional machine learning models.[b] But sometimes it is really difficult to figure out why neural networks perform either very well or very poorly. For example, when comparing with a decision tree algorithm, you can actually see the decision boundary or choices it makes. This provided some explanation to the model and you can adjust it from there.[c] Another downside to the neural network is that it requires a lot of data. In order to perform well it requires a lot of computational power.
We decided to use two hidden layers. This is because two hidden layers is enough to approximate any function that contains continuous mapping. We do not know how many neurons we need. It heavily depends on the data set. If we have too few neurons in the hidden layer, then it will result in underfitting. If we have too many neurons then it leads to overfitting. Another downside for having too many neurons is that it will take too long to train the network. We tested different neuron values in order to obtain the one with the highest performance.
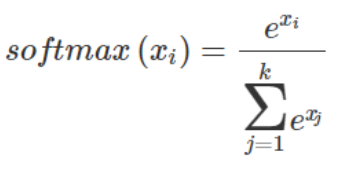
We define our network with two fully connected ReLu activated layers with 64 hidden neurons. This decision is through trial and errors. The third and last layer will be my output layer. It will consist of size 4. This layer will use a softmax activation function and will output a four dimensional vector. Each dimension will be the probability of certain input belonging to that class. The optimizer we use is Stochastic Gradient Descent. The loss function we use is categorical cross entropy. We use accuracy for my metric to monitor our network.
Softmax activation is similar to the sigmoid function such that it squash the output value between 0 and 1. It also divided each output by the sum of all output. This gives us a discrete probability for each individual class.
The sum of the output probabilities will be 1. This is really helpful for us to interpret the output for the classification task. [d]
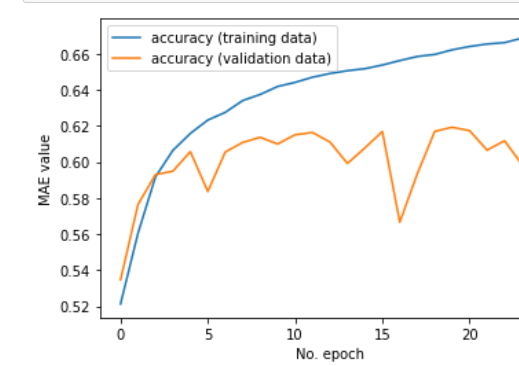
At the end of the training and validating we decided to choose the neural network model as our best model. We have attained a training accuracy of 67% and test accuracy of 61.5% using this model. We observe that maximum validation accuracy is achieved at around 20 epochs. After that, we observe that there is a decrease in validation accuracy and an increase in training accuracy. This implies that the model is getting better at classifying the training data, but making consistently worse predictions when it encounters new, previously unseen data. If this were a balanced dataset, a random attribution of labels would, using simple probability, result in 25% accuracy. But since this dataset is not balanced, the accuracy of a random classifier might be on the lesser side. Compared to the baseline logistic regression model we had built earlier that had only achieved 25.3% accuracy, the neural network model performs much better.
We gathered this dataset from Zenodo, which had been gathered using Google Big Query.[3] We had originally gotten this idea to do a project on the Myers-Briggs Personality dataset because we had come across a dataset about this topic on Kaggle[4]. One drawback from using the Kaggle dataset was that there were only around 8,600 rows in this dataset, which was not large enough. This dataset that we found on Zenodo solved this issue, since there are over 1.5 million rows to work with.
There is extensive research on the field of MBTI prediction. There is one study that was published at Stanford, which tried to predict the Myers-Briggs Type Indicator based off of text, similar to what we are attempting to do here.[5] They used the Kaggle dataset that I had mentioned earlier, which drew from postings on an online forum. They utilized a recurrent neural network (RNN) for this classification, training on the four binary classifiers (analysts, diplomats, sentinels, and explorers). After training, they took the average of the class probability predictions and rounded, giving them either 0 or 1, which gave them the classification. One task they did that I found fascinating was that they had attempted to generalize to other social networks, by giving the assumption that a classifier would improve its metric if given more social media posts for a single user. So to further delve into this assumption, they also scraped 30,000 tweets from Donald Trump’s Twitter account and tried to predict what personality type he was, and had deduced that the final prediction was ESTP, which is verified to be his actual personality type according to experts in this field.
Another piece of literature on predicting MBTI was found from another study done at Stanford, where they had tried to predict personality type not on the kinds of words that were posted, but rather the sentence structure and flow.[6] They utilized this approach with the assumption that introverts might display a different tone in their writing compared to that of their extrovert counterparts. They manually built the dataset, by using books from ten different famous authors for each personality type. In total, they had around 250,000 rows in their dataset after preprocessing this data. Testing out a variety of different models, like an unsupervised SVD, RNN with LSTM, and a feed-forward neural network, they had found that the RNN with LSTM had the best performance, with an accuracy of up to 37%.
Further, there is also work based on predicting personality types based off of Reddit data, much like the work that we had done. This was done from the University of Zagreb, where they also gathered their data using the database off of Google Big Query, and from there, selected all users who have any mentions of MBTI type within their flair field.[7] Much like the other work I had already mentioned, they had framed this prediction task as four independent binary classifications, testing it on a support vector machine (SVM), regularized-logistic regression, and a three-layer multilayer perceptron (MLP). The baseline model that they were comparing this to was the majority class classifier. The MLP model performed the best, giving them an accurate personality prediction about 42% of the time, which is significantly higher than their baseline prediction accuracy of 25%.
[1] “Personality Types.” 16 Personalities, www.16personalities.com/personality-types.
[2] How Rare Is Your Personality Type? www.careerplanner.com/MB2/TypeInPopulation.cfm.
[3] Storey, Dylan. “Myers Briggs Personality Tags on Reddit Data.” Zenodo, 30 July 2018, zenodo.org/record/1482951?fbclid=IwAR12-eZaiqRE_UNrtKp-8aepdKX31gh_ONJMiC0kQER7AZlKZ7Rojuj7TSM.
[4] J, Mitchell. “(MBTI) Myers-Briggs Personality Type Dataset.” Kaggle, 22 Sept. 2017, www.kaggle.com/datasnaek/mbti-type?fbclid=IwAR3PnLr5KR7LXufVIy0aUnm-O2ysyBxTvfd8iY3kOao4zQNMd8ehw44_kPs.
[5] Hernandez, Rayne, and Ian Scott Knight. “Predicting Myers-Briggs Type Indicator with Text Classification.” https://web.stanford.edu/class/archive/cs/cs224n/cs224n.1184/reports/6839354.pdf.
[6] Liu, Gus, and Anthony Ma. “Neural Networks in Predicting Myers Brigg Personality Type From Writing Style.” https://web.stanford.edu/class/archive/cs/cs224n/cs224n.1174/reports/2736946.pdf.
[7] Gjurkovic, Matej, and Jan Šnajder. “Reddit: A Gold Mine for Personality Prediction.” https://www.aclweb.org/anthology/W18-1112.pdf.
[a]PCA
[b]Explain and justify your decision to use the model you proposed
[c]What are the strengths
and weaknesses of the different models being compared?
pro:
1) Much better result compared to traditional machine learning model
cons:
1) Difficult to figure out explanation.
2) Required a lot of data
[d]Reason why I choose this activation function.